Understanding your Sendlane dashboard
Last updated: March 20, 2025
Overview
Your Sendlane Dashboard is a great way to quickly review your account's activity and gain insights into your marketing strategy's performance.
Read on to learn about each section of your Sendlane dashboard!
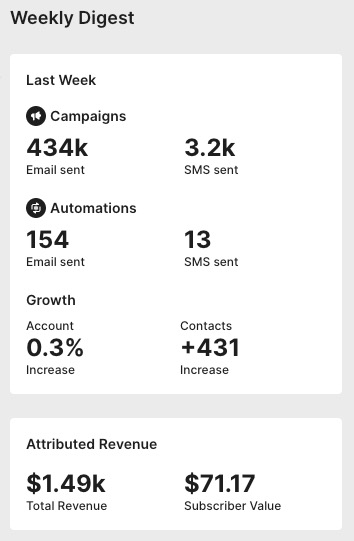
Weekly Digest
The Weekly Digest sidebar is a great way to see a quick overview of your entire Sendlane account. The information here refreshes weekly at midnight on Sundays EST, regardless of the time zone your account is set in.
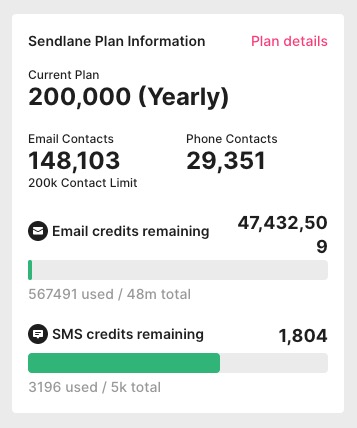
Sendlane Plan Information
Under the Weekly Digest is a quick view of your Sendlane plan stats, including your current email plan, the number of contacts currently in your account, how many emails have been sent so far in your billing cycle, and how many sending credits remaining in your billing cycle for both email and SMS.
Contacts, Email, and SMS
The Contacts, Email, and SMS sections of the Sendlane dashboard let you select from a set of preset relative reporting periods or a custom date range.
Hover over individual points in the Growth, Top Domains, and Source visualizations to view details for these charts:
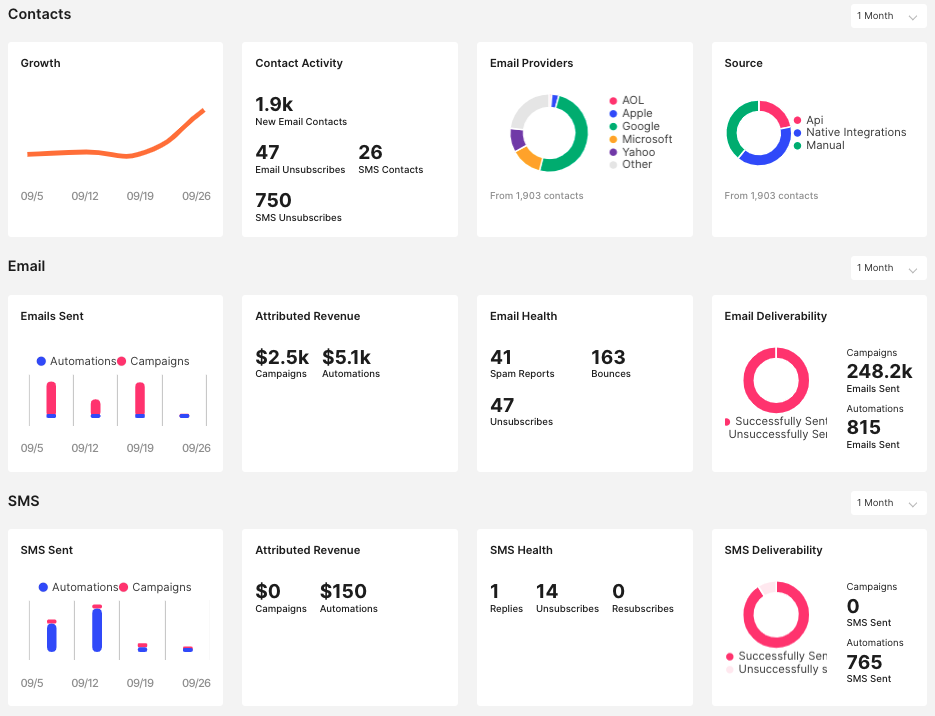
Contacts
The Contacts section shows an overview of your account's contact growth for both email and SMS, activity, email domain breakdown, and collection source.
Metric | How is it calculated |
Growth | Number of contacts added to Sendlane during the specified reporting period, including contacts that were imported as unsubscribed |
New Email Contacts | Brand new contacts added to Sendlane during that time frame (includes unsubscribed and subscribed). Does not include attempts at adding duplicates. |
Email Unsubscribes | Contacts who subscribed and unsubscribed during the specified reporting period. Contacts who unsubscribed during the reporting period but subscribed before the reporting period started are not included in this number. |
SMS Contacts | Contacts who have a phone number and were added to Sendlane during the reporting period. |
SMS Unsubscribes | Contacts who unsubscribed during the reporting period. |
Email Providers | Contacts who received an email in the reporting period broken out by email provider |
Source | Contacts who were added to your account broken out by how they were added |
Emails sent | The number of emails sent each day, broken out by campaign or automation |
Attributed revenue | The total amount of purchases attributed to campaign or automation email in the reporting period, broken out by campaign or automation |
Spam reports | The number of spam reports received during the reporting period |
Bounces | The number of bounces during the reporting period |
Unsubscribes | The number of email unsubscribes during the reporting period |
Email deliverability | The total number of campaign and automation emails sent successfully |
SMS
SMS sent | The number of SMS messages sent each day, broken out by campaign or automation |
Attributed revenue | The total amount of purchases attributed to campaign or automation SMS message in the reporting period, broken out by campaign or automation |
Replies | The number of SMS replies received during the reporting period |
Unsubscribes | The number of contacts who unsubscribed from SMS during the reporting period |
Resubscribes | The number of contacts who resubscribed to SMS during the reporting period |
SMS deliverability | The total number of campaign and automation SMS messages sent successfully |
Contacts Takeaways
Ask yourself the following questions while monitoring your Contacts data to keep your email and SMS marketing strategy agile and effective:
Growth - When did you experience periods of higher growth? What were your strategies then? How can you iterate on those strategies to keep your growth up?
Contact Activity - Are your unsubscribe and deleted/removed numbers stable?
Top Domains - Are you surprised by the breakdown of your Contacts' domains? Are you aware of best practices for each domain?
Source - Is the amount of time and other resources being invested in each source reflected in this chart?
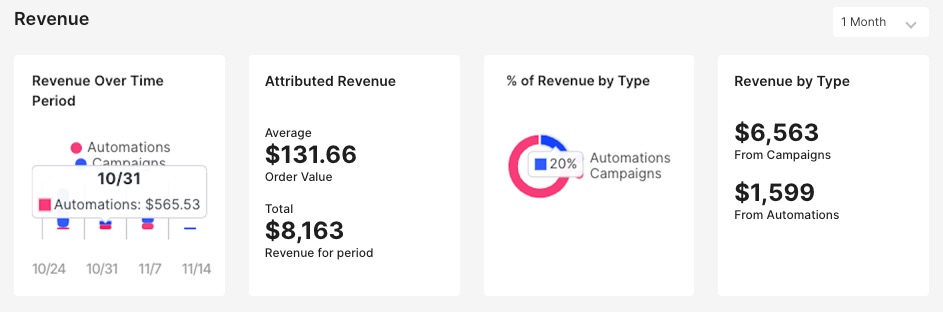
Revenue
The Revenue section provides an overview of revenue earned from Automations and Campaigns
Hover over individual points in the Revenue Breakdown and % of Revenue by Source visualizations to view details for these charts:
Revenue Takeaways
Ask yourself the following questions while monitoring your Total Account Revenue data to keep your email marketing strategy agile and effective:
Revenue Breakdown and Attributed Revenue - When do you see higher revenue? What were your strategies then? How can you iterate on those strategies to keep your revenue up?
% of Revenue by Source and Revenue by Module - Is the amount of time and other resources being invested in Campaigns vs. Automations reflected in this data?
When you're able to see which messages have the highest revenue and engagement, you can uncover which strategies work best for your audience and leverage those more effectively to boost your engagement and ROI!
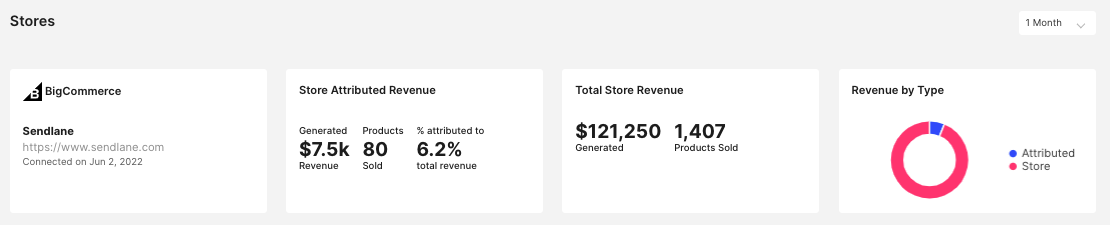
Stores
The Stores section populates data from your connected eCommerce integration, or provides instructions for integrating supported eCommerce integrations.
Latest Campaigns
In the Latest Campaigns section you'll see a "quick look" at the last 5 email or SMS Campaigns sent from your account, including open rates (email only), click rates, and attributed revenue for each Campaign
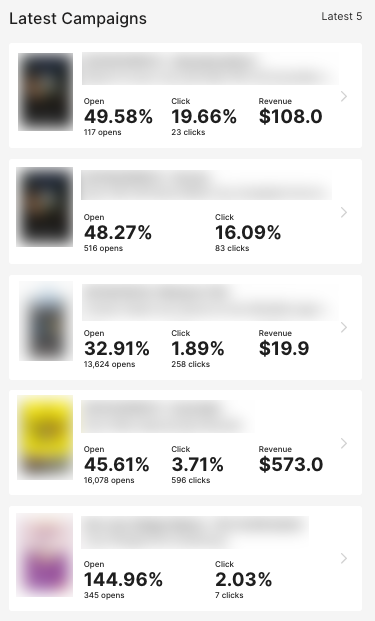
Takeaways
When you have visibility into the performance of your most recent campaigns, you'll be fully in-the-know about how well your one-time sends are working, and either reassess and adjust, or maintain your strategy as needed!
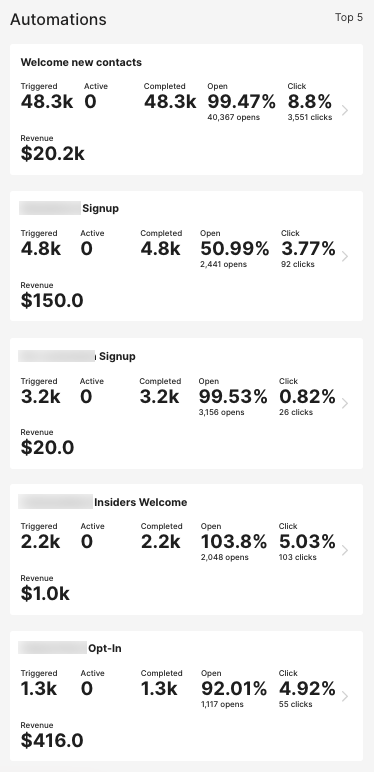
Automations
In the Automations section you'll see your Top 5 Automations, including the number of times the automation is triggered, how many contacts are currently active within the automation, how many contacts have completed the automation, the open rate, click rate, and revenue (if any) of each automation.
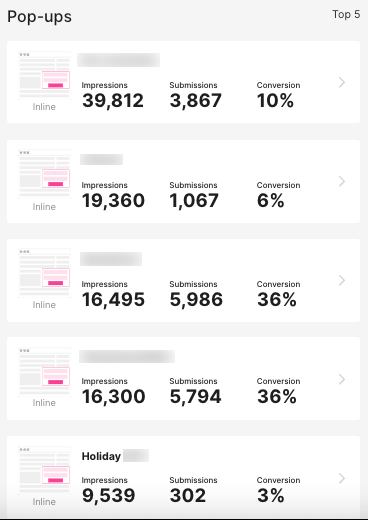
Forms
In the Forms section you'll see your top five best performing (most subscriptions) forms.
This section shows how many impressions and submissions along with the conversions rate of those forms.
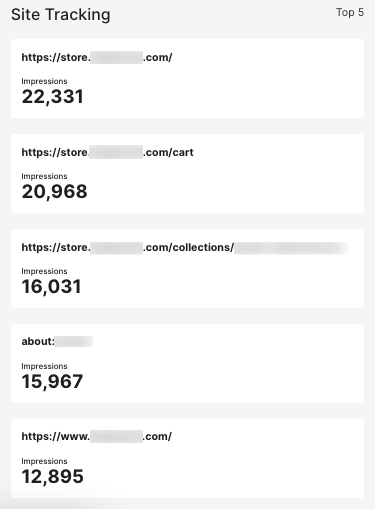
Site Tracking
The Site Tracking section shows the top five Beacon events on your website by the number of total visits, or Impressions. Impressions count each page view even if the same Contact visits the page multiple times.